Using Power BI and People Inc.
Linking HR data to an organisations other data asset can add multiple dimensions to data analysis. People Inc.s databases can be accessed by Power BI to leverage additional insights.
Introduction
Overview
Data analysis is a key part of data management within an organisation. People Inc. comes with a fully featured report writing tool which can be used to create almost any type of report. In the age of data warehousing having data isolated in one system is not always ideal. Power BI is a reporting tool developed by Microsoft. It has similar features to People Inc.s reporting tool and can combine data from multiple data sources.
Power BI is a data visualisation tool made by Microsoft. Power BI can take data from various data sources and users are able to design reports and dashboards which can help identify patterns and aid business decision making. A free desktop version is available from Microsoft with subscription-based plans allowing for a wide range of additional features.
People Inc. hosts a wide range of HR data which is highly valuable in data analytics for any organisation. Included in People Inc. is a comprehensive report writing tool as well as data export utilities. The People Inc. system uses Microsoft SQL Server databases to store its data, its reports and data exports are compatible with Microsoft Excel it is straight forward to add People Inc. data to Power BI.
Power BI and the People Inc. report writing tool provide highly similar functionality; the significant different is that Power BI allows for the connection of multiple data sources in a single report. For organisations interested in data warehousing and analytics this makes Power BI an important tool.
SQL is an abbreviation of Structured Query Language. This is the main language used to write queries that get data from a (relational) database. A query can simply be thought of as a question that the database answers with a data table.
A database server is a piece of software that hosts one or more databases. When computer programs send queries to the database server it decides how to actually get the data based on the query it was sent.
Connecting to the Database
Connecting directly to the People Inc. database does provide an easy way to access all the data the People Inc. system uses. Whilst this is convenient it is important to consider that doing so bypasses all the checks and balances the People Inc. system uses to control who has access to what data. This risks of doing this need to be understood and considered before connecting to the database in this way.
Microsoft SQL Server does allow users to be give restricted access to individual databases and also what actions they may take. Permissions should always be designed to provide the minimum privilege users based on the intended task. For reporting and analytics, a user will require read permission on a People Inc. database; SQL Server also allows for users can also be granted permissions to only read data from specific tables and more. For more information about creating user permissions refer to the official documentation. It is typical for direct access to a database to be restricted over a corporate network, it is also possible to use reports or data exports from People Inc. to create a data sources which Power BI can use.
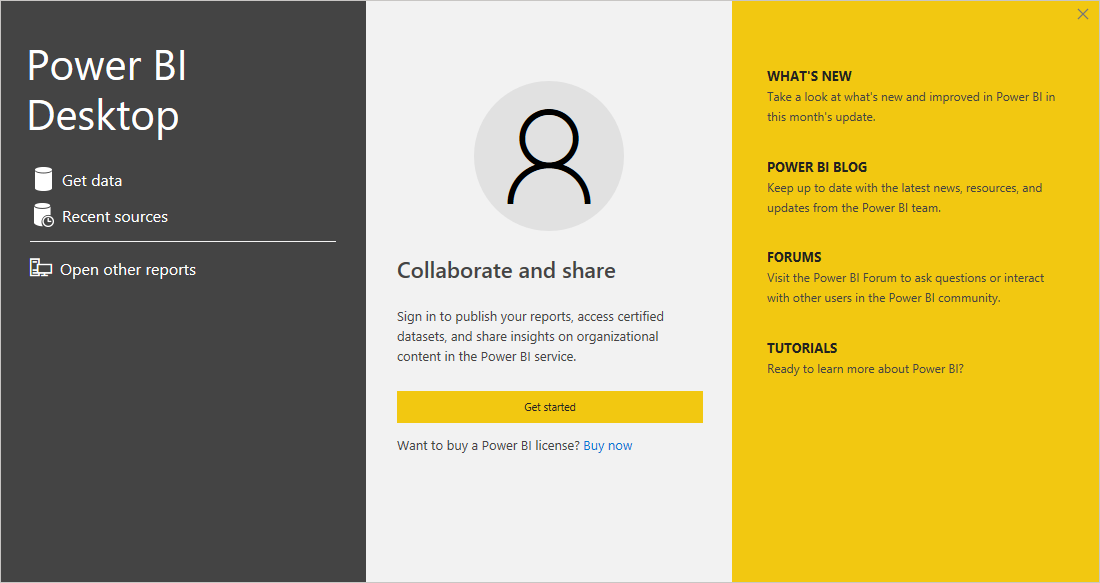
To connect to a People Inc. database using Power BI Desktop launch the program and click on Get data.
Power BI Splash Screen
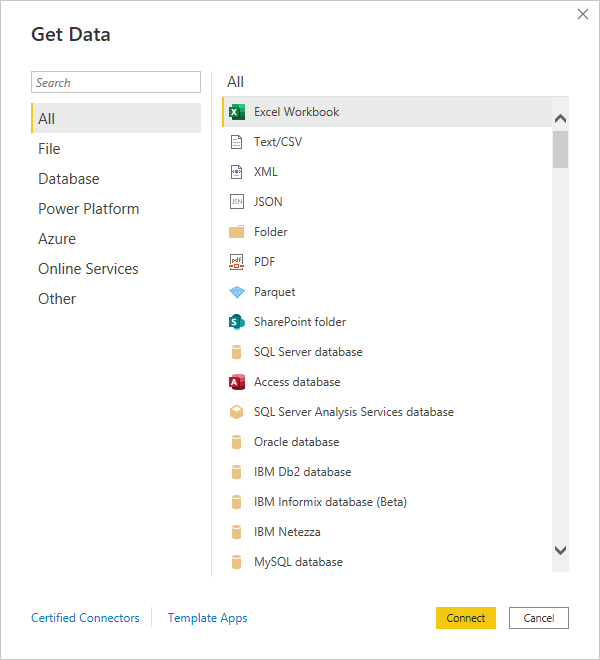
Select SQL Server database from the available options, or Excel if using the source is a spreadsheet or text file.
Get Data
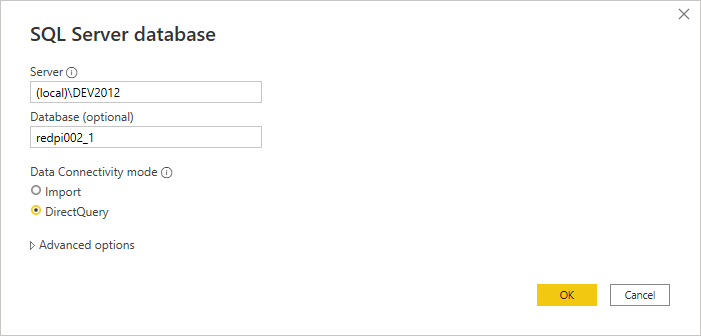
Enter the connection information for the SQL Server to connect to. People Inc. supports multiple client databases (for example, this allows multiple companies to be managed in a single HR system whilst keeping employee data in separate databases). It is possible to find the logical name of People Inc. databases using the System Administration Module, each system comes with a database of demonstration data; its logical name is redpi002_1.
Data connectivity mode should typically be set to DirectQuery when working with a database. This means that the data in the database will be checked each time a report is run in BI (so changes and updates are reflected). Using Import creates a static snapshot of the data meaning any subsequent changes to the data will not be reflected in the report (this may be more appropriate when working with exported data).
Connection Settings
When OK is pressed Power BI will prompt for the credentials required to directly access the database. These will have been set up by the database administrator and are not created or managed from within the People Inc. system.
Log onto Database Server
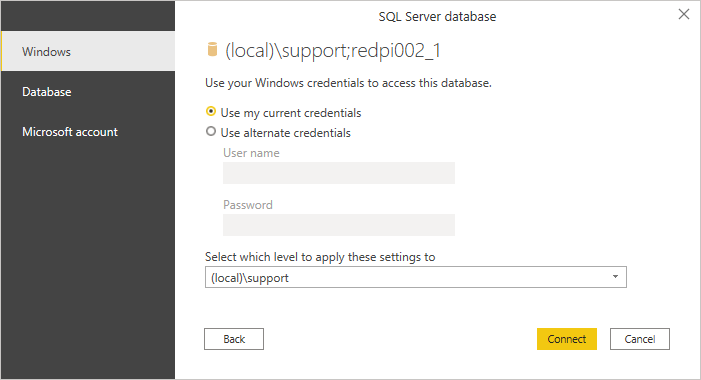
When the Connect button is clicked Power BI will test the connection and retrieve a list of the tables and views from the database which the user is able to interact with.
The People Inc. databases are based on standard relational models. This means that different types of data, absence data for example, is kept in a particular table. Other data is kept in other tables, such as the jobs an employee has had. This means that no table in the database contains absence information and an employees name (although this may be available to some extent via views). In order to work with data an understanding of basic database concepts is required.
In the below example the absencehistory table only is added. The report which will be created is going to show a working hours list by absence category. For the purposes of an example this is sufficient, it is worth noting though that this will produce a very poor analysis of the data. Without defining a reporting period (a range of applicable dates) no insight can be gained from the totals.
Navigator
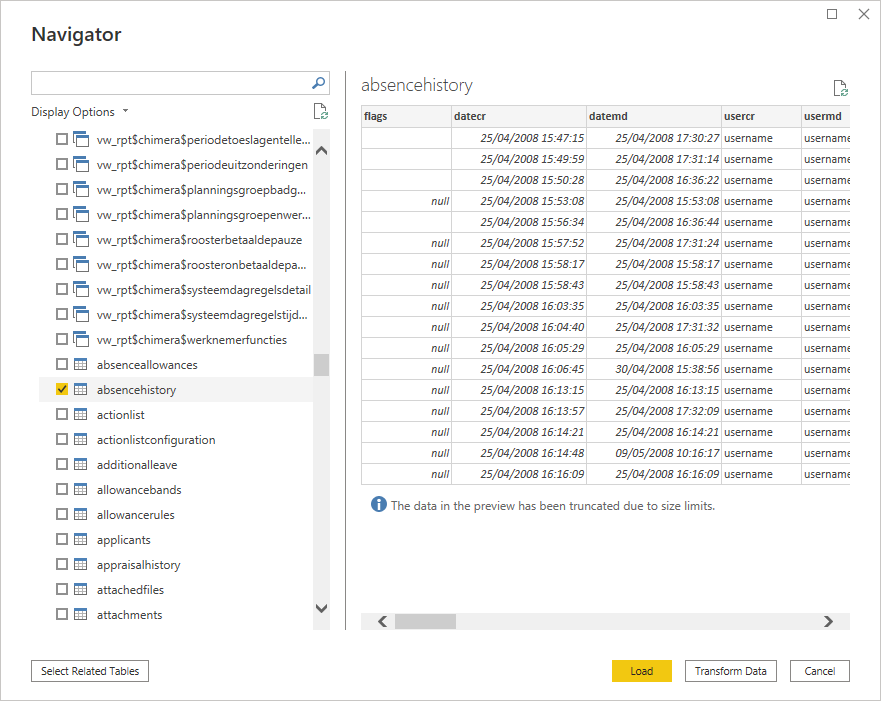
Press Load and Power BI will analyse the table and provide a list of fields (seen on the right of the below image).
Field List
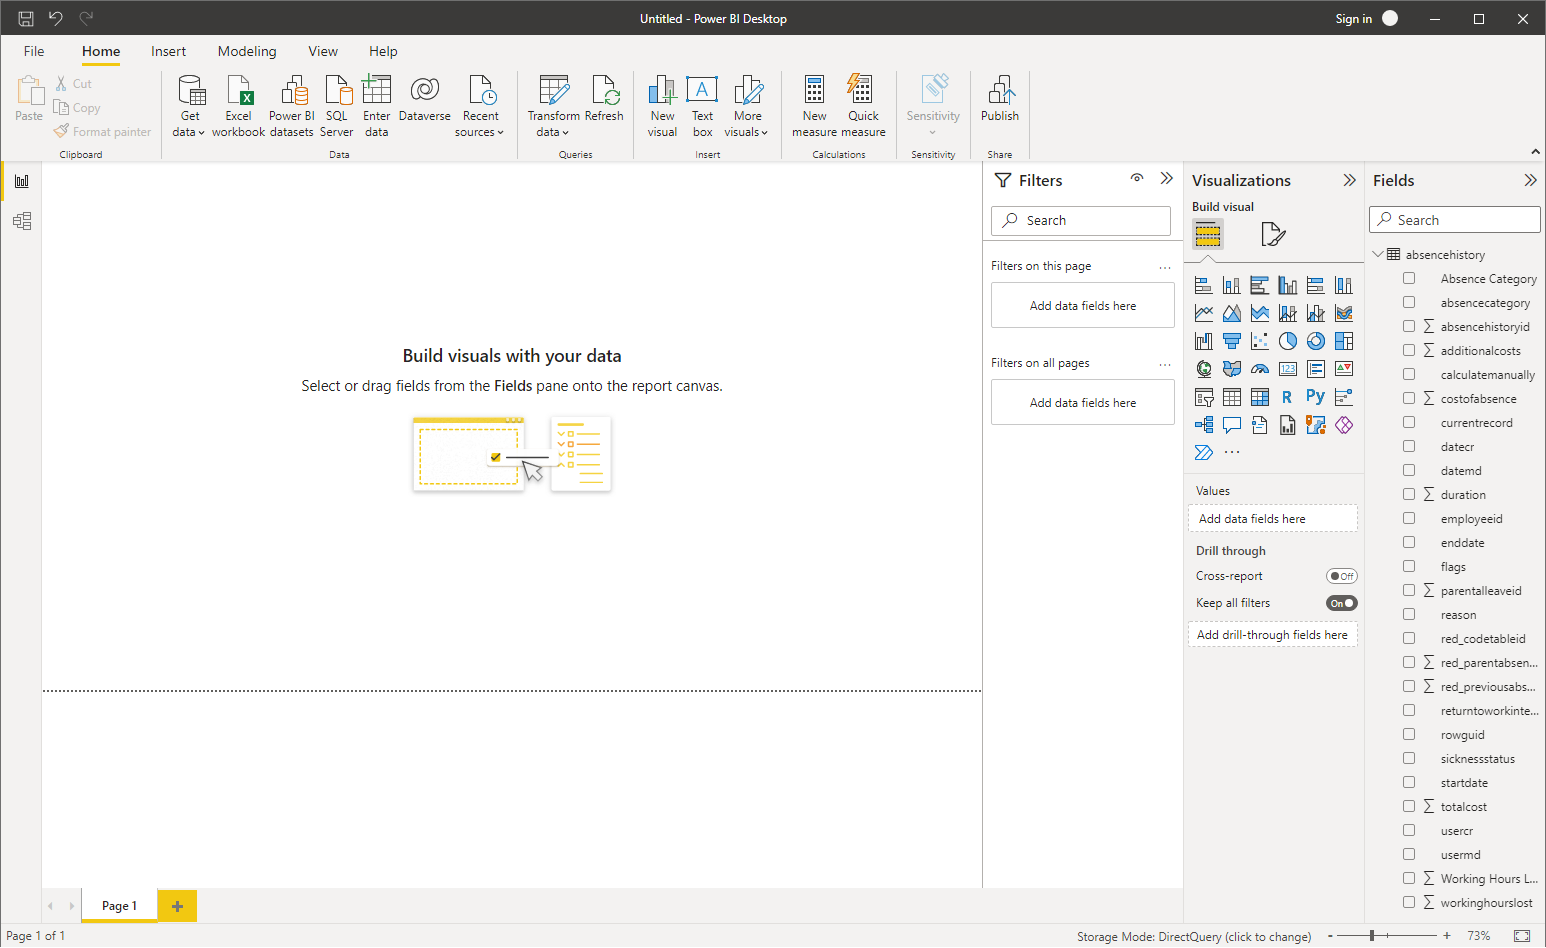
Since the data is loaded directly from the database the table only shows the logical name for fields in the table. Within the People Inc. reporting tool, we are able to collect the display name for each field automatically based on the users language preference.
In Power BI right click on a column name and select Rename, this will not change the logical name of the field and will allow a friendly display name to be shown in the report.
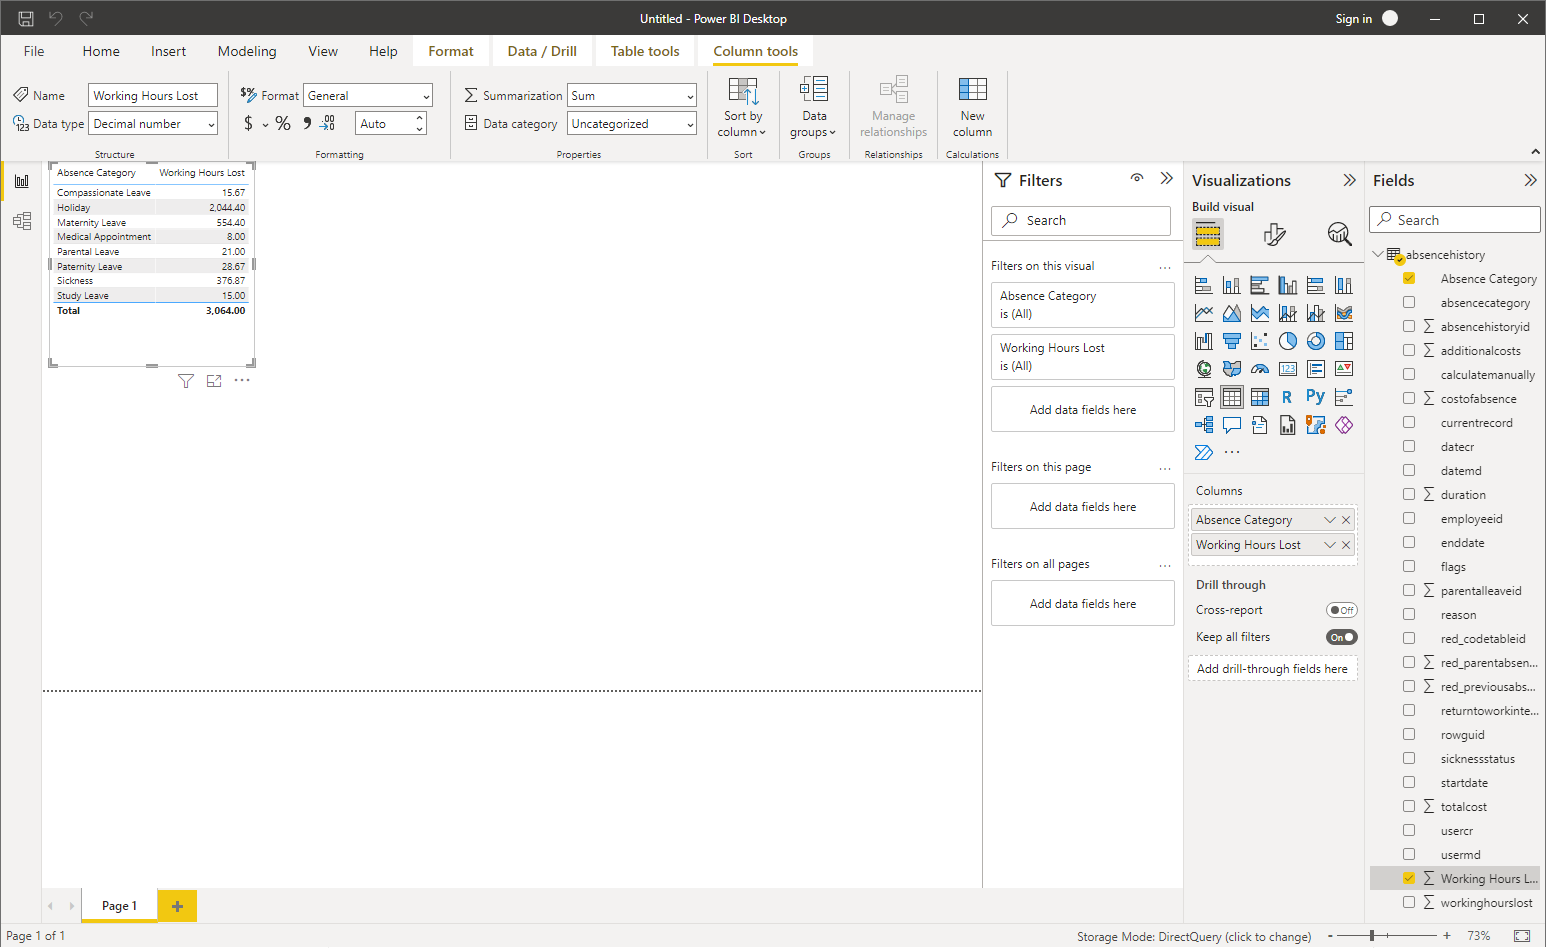
Select Absence Category (absencecategoryid) and Working Hours Lost (workinghourslost) by ticking the corresponding entry in the Fields list on the right-hand side. This will automatically generate a table in the left panel showing the total working hours lost per absence category.
Selected Fields
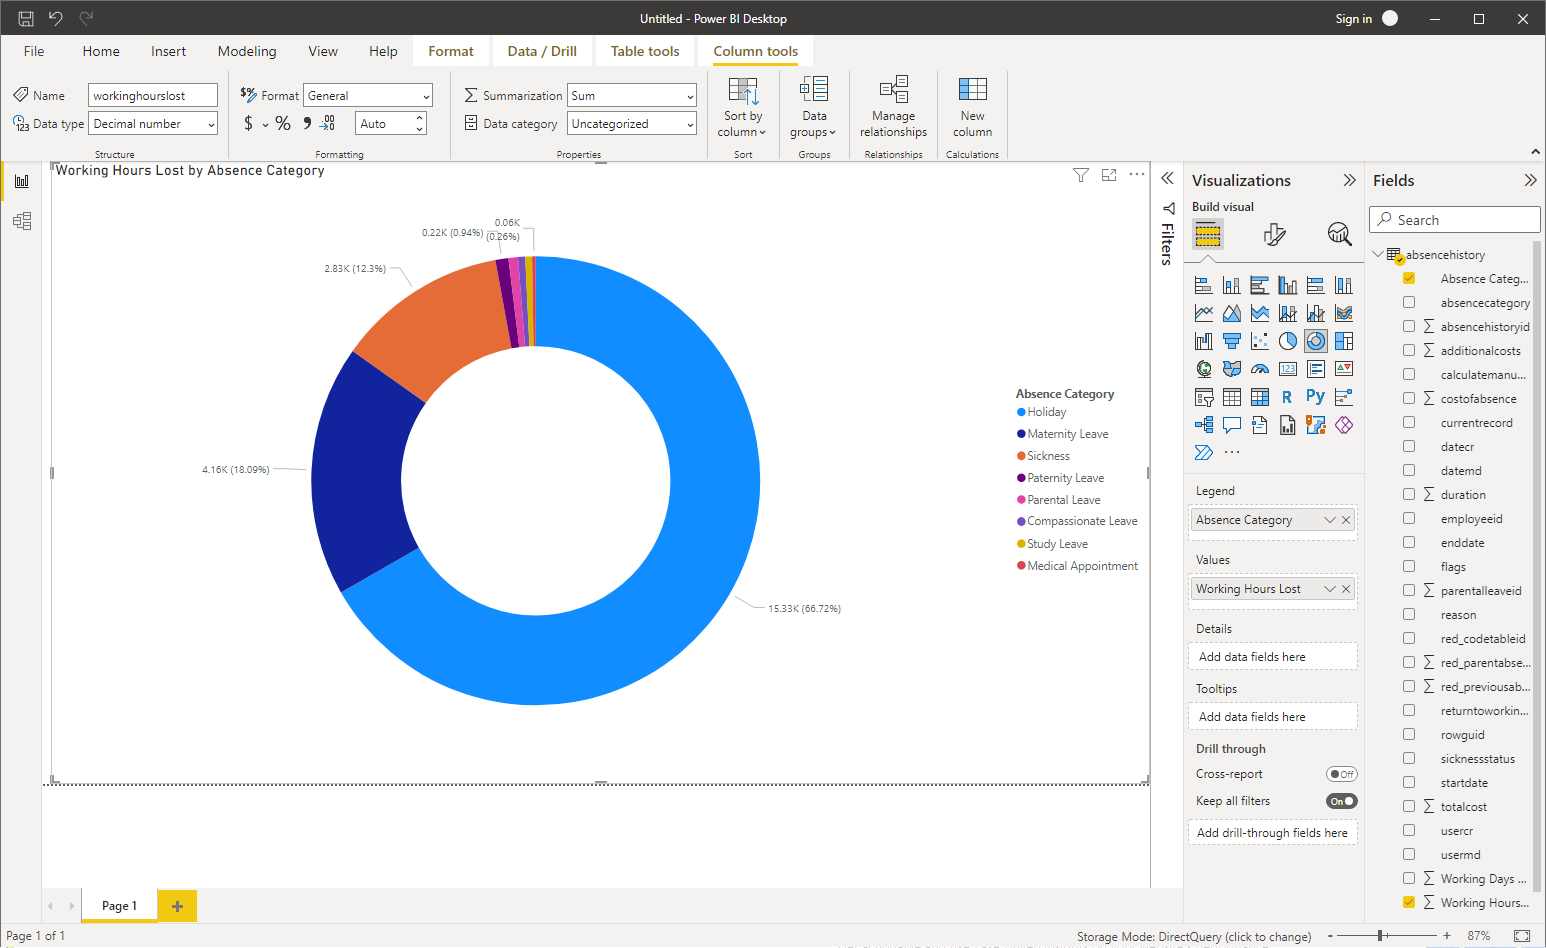
With the fields selected it is them possible to click on the different charts in the Visualizations menu. Double clicking on the Donut visualization gives the below chart.
Charts
It is also possible to expand on the data and change chart types. In the below the reason field is included and the visualisation changed to a stacked bar chart.
Additional Fields

Considerations
The above example takes a highly simplistic view of analytics and the database structure, it is intended only to demonstrate how data from People Inc. can be used within Power BI. The process is highly similar to creating reports within People Inc. with all the same steps present. As with the report writing tool in People Inc., Power BI also allows for advanced data filtering and the addition of custom code.
Care must always be taken in how data is processed to maintain compliance with the relevant laws, although it opens up a wealth of interesting possibilities.
Relating environmental data (such as the weather) to other datasets can make them much easier to understand. Some energy companies will let their customers overlay weather data with their energy usage to make it easier to understand and predict.
In a similar way a shop linking inventory data to weather data will be able to predict how much ice cream they may need. They could also add in a third set of data, the dates of (local) sporting and community events, to help realise other likely peaks and troughs in demand throughout the year.
The significant difference between the People Inc. report writer tool and Power BI is that Power BI will allow data to be connected from multiple sources. Combining different data sources is a very power concept which can be used to create new insights and learning within an organisation. However, it is important to note that this must be done with a great deal of care. Incorrectly using data will lead to incorrect information which can cause costly mistakes.
To be able to work with the data in People Inc. to deliver accurate analysis an understanding of the system is required. An obvious example of this is within the concept of FTE and the definition of one working day; People Inc. allows for the definition of any number of full-time hours which in turn means (at the extreme) every employee could have a different length working day. To help with this absence is calculated by the system in both days and hours.
Data protection laws do protect the way in which certain data can be used and also who should be able to access this. Information relating to a persons health is considered to be special category data which has additional specific requirements. Before using any data, it is important to do an appropriate risk assessment to cover both the security of the data as well as the intended use of the data; the outcome of such assessments should always be recorded.
Our consultants understand the way in which People Inc. structures data and have insights into how that data can be used in a data warehouse / data analytics system. If you require more information on this please do get in contact and we will be able to help.
Related Features
There are a number of features included with the People Inc. system that are designed tohelp with reporting and data management. Some examples are provided below:
Reporting
People Inc. includes a fully functional report writing tool which can be used for analytics.
Infrastructure
We use standard Microsoft SQL technology to store and manage data in the People Inc. system.
Employee Attendance
Staff Attendance is just one of the important pieces of information which People Inc. helps manage.
External Resources
The following links provide additional information about resource planning and employee attendance. The links are to pages on websites over which we have no control. This information is provided for reference only.
Power BI (powerbi.microsoft.com) - External Link.
Data Analysis (www.wikipedia.org) - External Link.
Data Warehouse (www.wikipedia.org) - External Link.
- Article Index
- Managing Core HR Records
- Managing People Inc. Data
- Send Employees Letters
- Training Matrix - People Inc. or Excel
- Managing Additional Bank Holidays
- Getting more from the ESS
- Absence Management
- Managing Training Records
- Managing Activities and Tasks
- Resource Planning
- Variable Work Patterns
- Absence Year End
- Calculating Holiday Entitlement
- FTE and Leave calculation in Excel
- Create a Training Matrix in Excel
- Reporting Accidents at Work
- Ideas and Suggestions
- Flexible Working Requests
- Managing Flexible Working
- Training Evaluation Forms
- Performance Reviews
- Historical Employee Records
- Competency Management
- Reviews, Competencies and the ESS
- Power BI and People Inc.
- Logging Job-Related Hours
- Timesheets in People Inc.
- Types of HR Management System
- Selecting HR Software
- GDPR and People Inc.
- Absence Management Software
- Time and Attendance Software
- Human Resources Software the future made simple
- HR Software moving forwards
- HR Management Software - An affordable solution?
- The Power of Employee Self Service Software
- The benefits of an Employee Self Service system
- HR Management Software by People Inc.
- Personnel Management Software by People Inc.
- People Inc. Employee Intranet
- Competency Framework
- HR Software The future made simple
- Building in Benefits
- HR Software moving forwards
- An affordable HR solution?
- The Power of Employee Self Service Software
- Employee Self-Service Software; moving with the times
- HR Management Software by People Inc.
- GDPR
- Personnel Management Software by People Inc.
- Why use HR Software?
- The benefits of Personnel and Human Resource Management
- Human resources software
- Online recruitment software
- Software for Human Resources
- Nursery chooses human resources software
- Employee Self Service Systems
- Employee Software - Moving with the times
- Legacy Systems: Personnel Director
- Personnel Manager - Legacy Systems
- Managing HR Data
- Balancing Considerations
- Ways to personalise People Inc.
